Overview - ETB Analytics
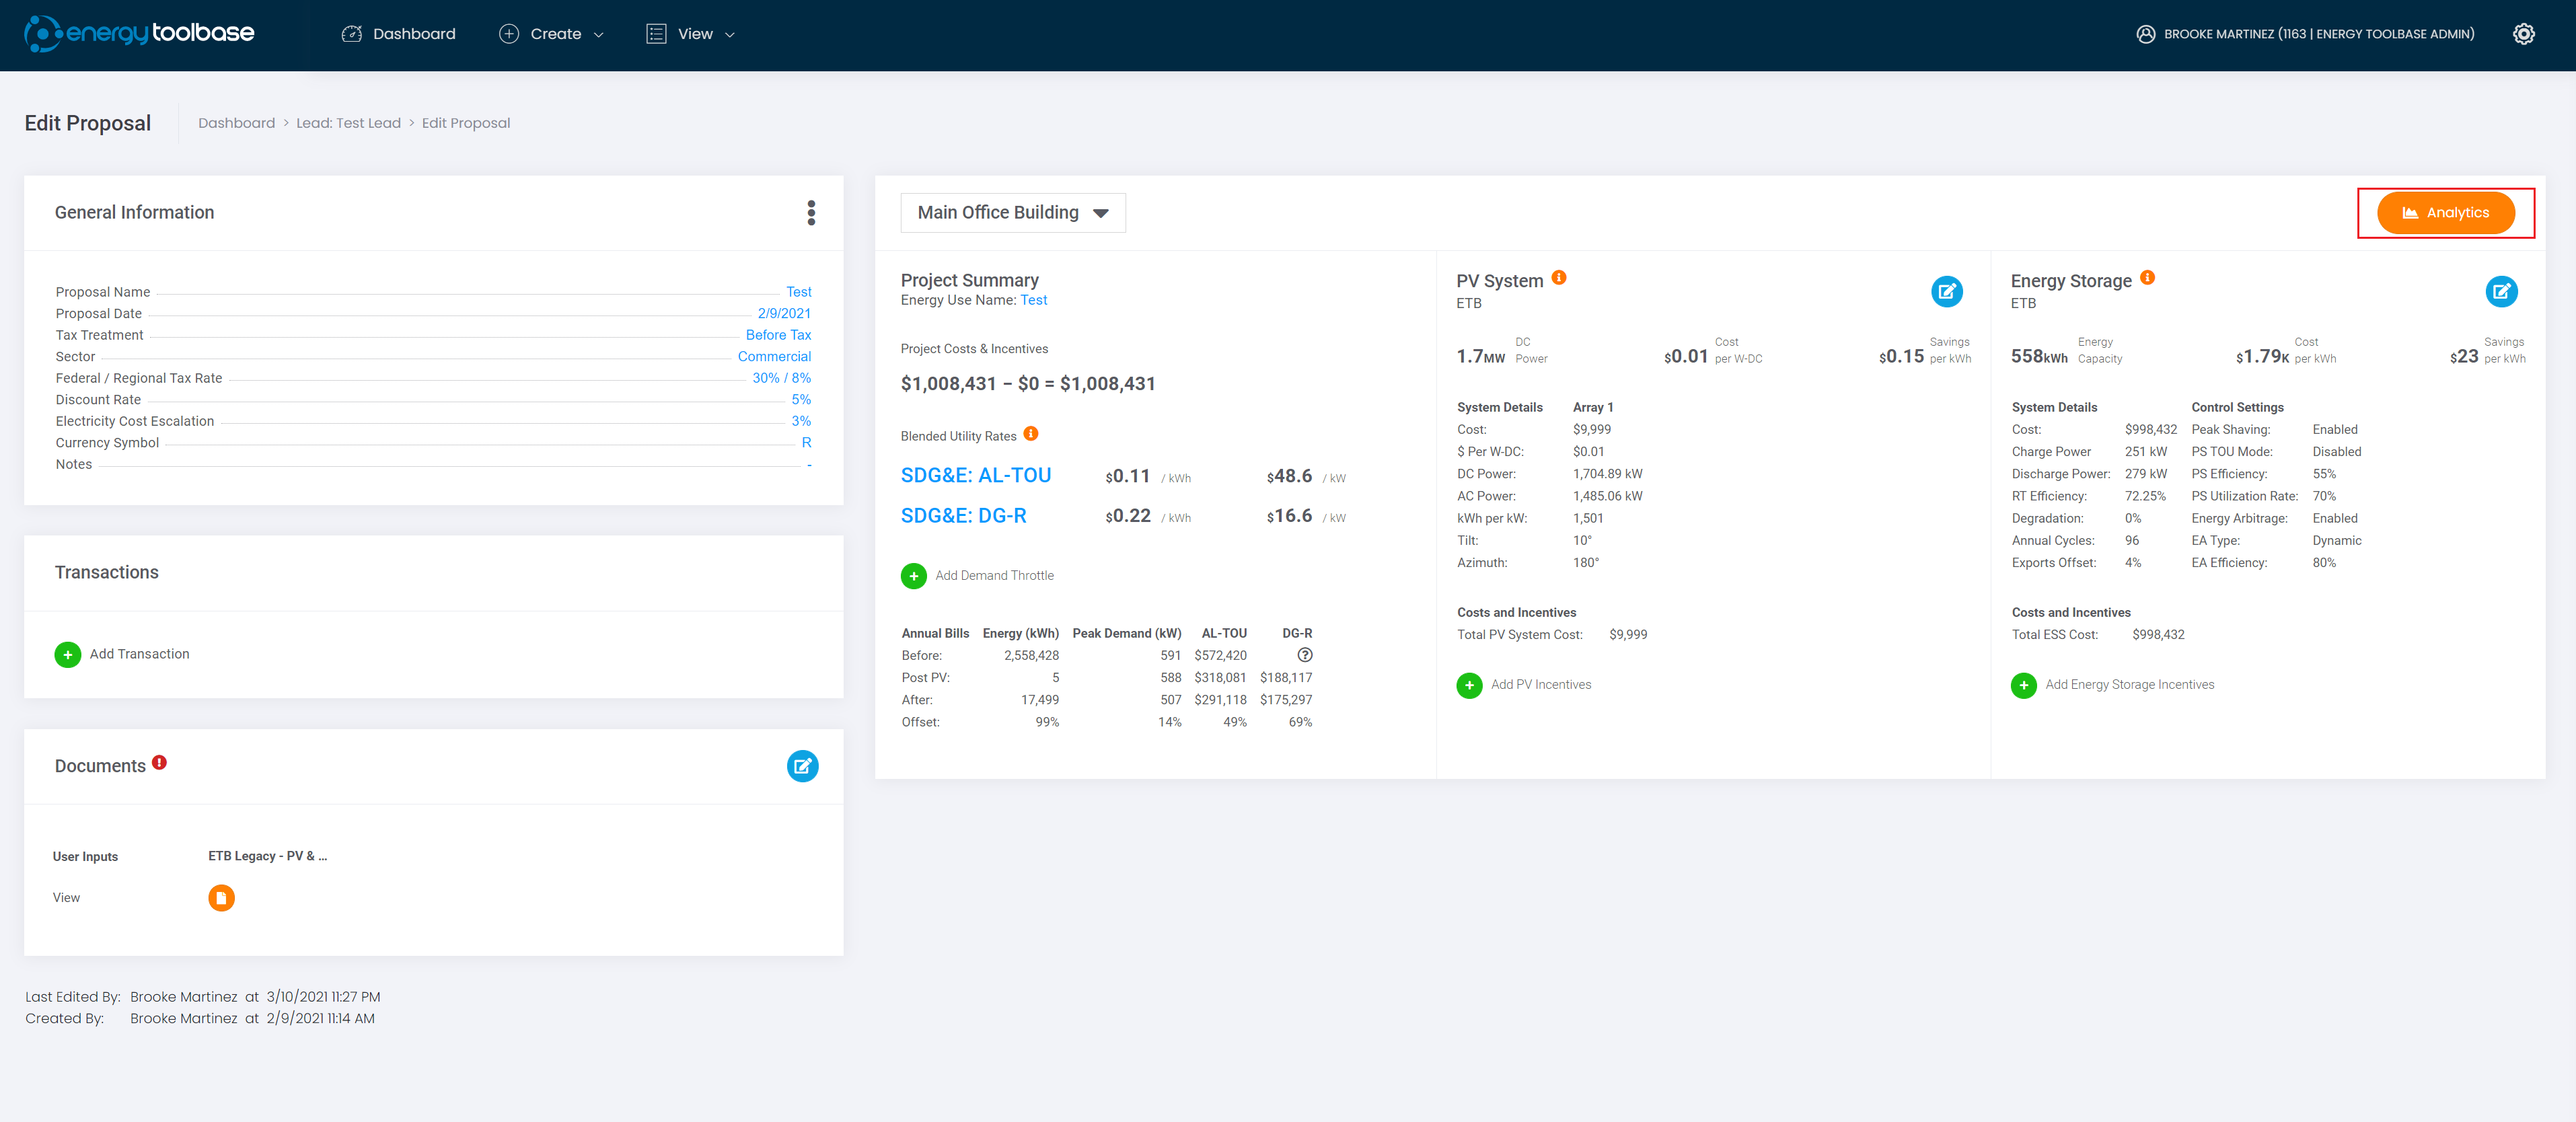
The 'ETB Analytics' screen, which can be accessed by clicking the orange button in the upper right of the 'Edit Proposal' screen, is a powerful tool that users can utilize to gain both granular and high level insights into the project they are modeling. ETB Analytics can be broken out into two distinct components:
- Monthly Electricity Costs
- Demand Profile Visualization
Tables & Graphs within the ‘ETB Analytics’ tool:
- Monthly Electricity Costs: displays a 12-month summary table of electricity costs.
- Demand Profile Visualization: an interactive charting environment that allows users to visualize their customer’s data.